How Did Owner-Operators Perform in the First Half of 2026?

Capacity is leaving the market and net income for the average owner-operator has climbed 10.4%. At the same time, a spring spike in diesel prices took a big bite out of those gains. It has been a very interesting first half of 2026.
Below, we break down the mid-year data and tackle the questions owner-operators are asking most:
How much capacity has actually left the market, and how much more could follow?
Where do miles, revenue per mile, fuel, maintenance, and net income stand at mid-year?
Are higher rates translating into higher profits?
Is the widening spread between spot and leased pay worth chasing with your own authority?
What does the rest of 2026 look like?
Want the full picture? Watch the 2026 Mid-Year Independent Contractor Benchmarking Webinar for a deeper look at every segment and what the numbers mean for your business through June 2026.
Freight Rates

The spot market boom of mid-2020 to spring 2022 remains one of the sharpest run-ups trucking has ever seen. What followed was a long slide, with load volumes and rates stuck near the bottom for close to three years. This year, the market finally broke out.
A few snapshots show how far things have moved:
Peak - November of 2021
Load-to-truck ratio: 240 posted loads for every available truck.
Rate: $2.74 per mile, excluding fuel surcharge.
September 2025
Load-to-truck ratio: 88 posted loads for every available truck.
Rate: $1.88 per mile, excluding fuel surcharge.
2026 Peak
Load-to-truck ratio: about 200 posted loads for every available truck.
Rate: $2.76 per mile, excluding fuel surcharge, with surcharge adding another $0.63.
August 2026
Load-to-truck ratio: 134 posted loads for every available truck.
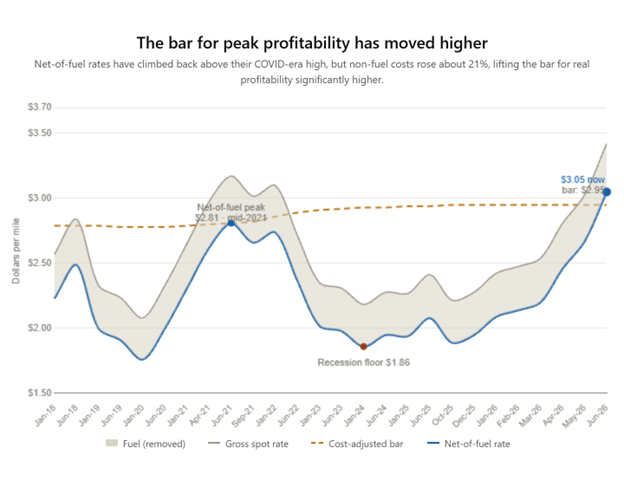
Base spot rates have now edged past their November 2021 high. Compare that to the roughly $1.86 per mile that spot freight paid for much of the last three years, a stretch that squeezed anyone depending on load boards. Freight demand has eased since the 2026 peak, but loads per truck are still far above anything we saw from 2023 through 2025.
Higher rates are only half of the equation, though.
The owner-operator’s non-fuel cost per mile has climbed from $0.68 to $0.82, with truck payments up 23%, maintenance up 20%, and insurance up 18%. Although rates have dipped since the peak a couple of months ago, they are still elevated from this time last year. The owner-operators who come out ahead will be the ones who keep a tight grip on costs and choose their loads carefully.
Miles

The average owner-operator logged about 94,440 miles over the past 12 months, a 2.5% drop from the prior year. Flatbed bucked the trend as the only segment to run more, up 1.5%.
The timing ran against the usual seasonal rhythm. Mileage slipped through the back half of 2025, then picked up in the first half of 2026 once freight came back and there were loads to haul. Even so, annual miles remain far below the 111,137 average from 2018.


Owner-operators earned $1.96 per mile on average, 21.1 cents (12.1%) more than a year earlier. Most of the jump showed up between March and June 2026. Every segment moved higher, with flatbed gaining the most at 30 cents per mile.
Fuel is part of this story in a way it was not last year. When diesel spiked in the spring, surcharges climbed right along with it, which inflates revenue per mile. The underlying rate improved too: excluding surcharge, revenue reached $1.71 per mile in June.
Better pay per mile more than made up for fewer miles. Gross revenue rose $15,712 (9.3%) to $184,765, and monthly revenue topped $18,000 in May and June compared with about $14,000 a year earlier. Flatbed posted the largest increase at 17.5%.
Fuel

No expense moved more in the first half of 2026. With national diesel topping $5.00 a gallon this spring, fuel cost per mile climbed 9.3 cents (19.0%) to $0.582. For the average owner-operator, that added roughly $7,591 to the annual fuel bill.
Measured against revenue, fuel ate up about 44 cents of every dollar of the per-mile rate increase: 9.3 cents out of 21.1.
Volatile diesel puts a premium on two things: getting the most out of every gallon and knowing exactly how your surcharge is calculated. The average truck returned about 7.05 MPG in June, and at $5 diesel even small efficiency gains add up fast. A surcharge can soften a price spike, but an efficient truck is what turns it into margin.
Maintenance
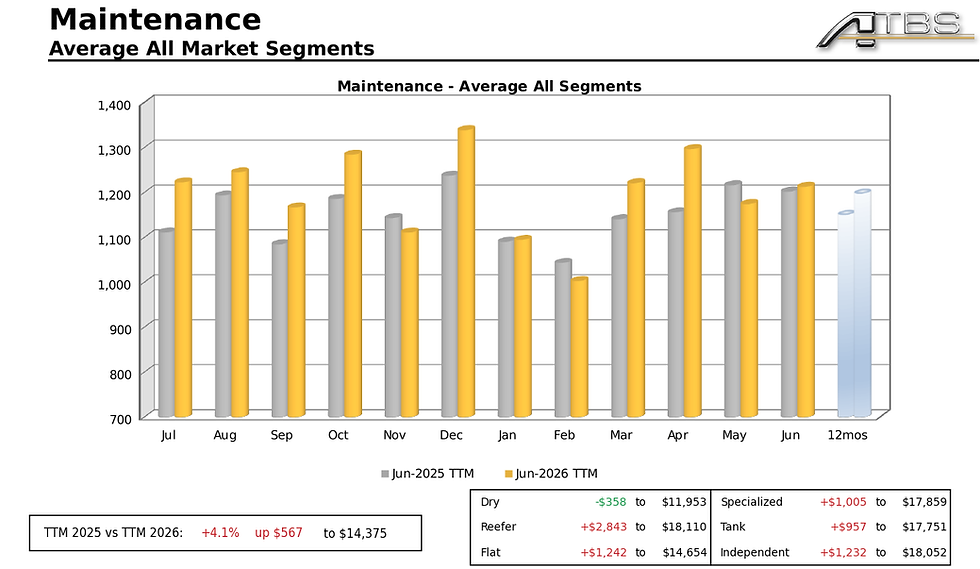
Keeping the truck running cost the average owner-operator $14,375 over the past year, $567 more than the year before. Reefer operators took the biggest hit at $2,843, and dry van was the lone segment to spend less.
Shop labor rates, parts prices, and aging equipment are all still pushing costs higher. The lesson carries over from last year: build repairs and downtime into your budget before you need them. A maintenance reserve is what keeps one bad breakdown from turning into a lost month.
Net Income
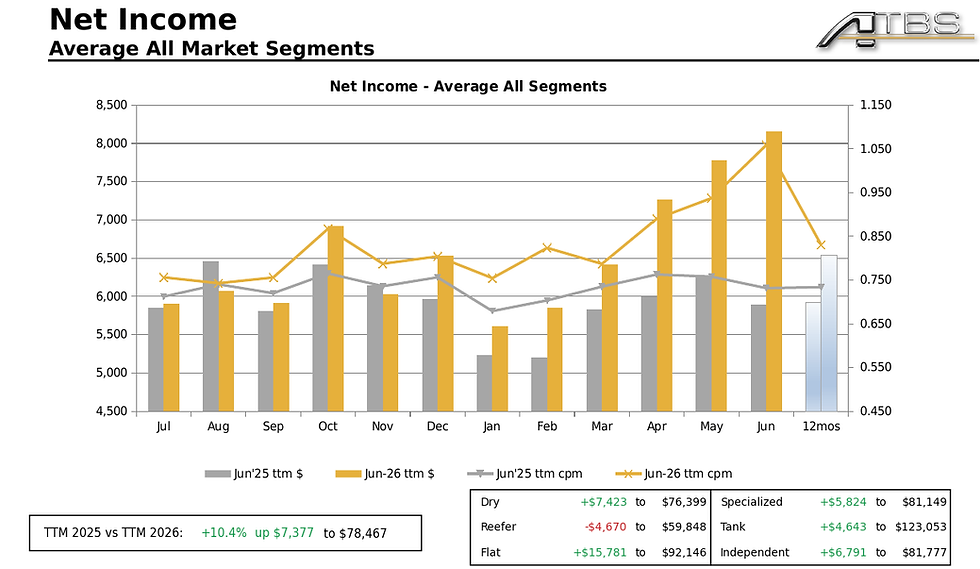
The bottom line improved meaningfully. Average net income reached $78,467, up 10.4% from a year earlier, after inching up just 0.5% in the 2025 year-end results. On a per-mile basis, owner-operators kept 83.1 cents, up from 73.4. June stood out, at $8,154 for the month, or $1.06 per mile.
Every segment but one came out ahead. Flatbed gained the most, adding $15,781 to reach $92,146, and tank held its spot at the top at $123,053. Reefer slipped $4,670 to $59,848, with fuel and repair costs outrunning its rate gains.
At the top of the range, the numbers look even better. As of the second quarter, the top third of ATBS clients were on pace for $200,843 a year, and the top 10% for $313,580.
Rates opened the door this year. Discipline is what gets you through it.
Knowing your cost per mile, managing expenses, running efficiently, and being selective about freight are what separate the operators who capture this upswing from those who just ride it. A better market lifts everyone, but it widens the distance between owner-operators who run a business and those who simply drive.
Rest of 2026 Outlook
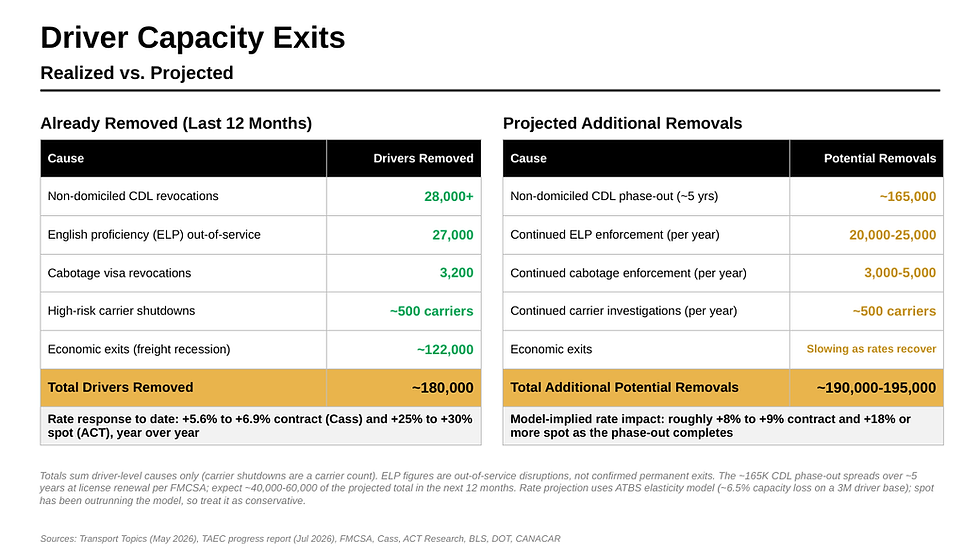
Earlier this year, we projected that the crackdown on illegal driver capacity could take 5 to 12% of drivers off the road. The data now shows it happening. An estimated 180,000 drivers have left in the last 12 months, including about 122,000 economic exits and more than 58,000 removed through non-domiciled CDL revocations, English Language Proficiency enforcement, and cabotage visa revocations.
More will follow. As non-domiciled CDLs expire over roughly the next five years, another 190,000 to 195,000 drivers could exit. Rates have already responded, with contract rates up 5.6 to 6.9% and spot rates up 25 to 30% year over year, and the ATBS model points to another 8 to 9% on contract rates as the phase-out completes.
The gap between spot and leased rates is also widening. In June, dry van spot rates averaged $3.03 per mile versus $2.16 for leased owner-operators. At 95,000 miles, that is about $83,000 more in revenue on the spot market, or roughly $31,000 more after the added costs of running your own authority. That gap could pull some leased operators toward the spot market, though new authorities are finding freight harder to secure as enforcement tightens.
Strong operators are already capitalizing on this market. Whatever the second half brings, the decisions you make on costs, equipment, and freight today will shape how much of it you keep.