Trucking Rates Have Passed the COVID-Era Highs. The Real Question Is What That Means for Profitability.

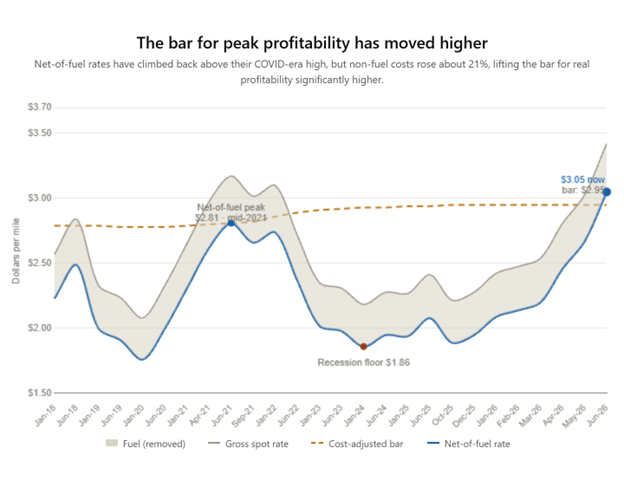
Rates have risen quickly, and the headline numbers look better than they have in years. But the number on the load board and the margin in your pocket aren't the same thing this time around.
For the past three years, carriers were stuck in a brutal squeeze. Rates fell from pandemic highs, freight demand softened, and operating costs climbed. The result was one of the most difficult margin environments the industry has ever seen. Some carriers exited the market, and the survivors were forced to become more disciplined while operating near break-even or worse.
Finally, in 2026, the crackdown on illegal capacity took hold and the market turned. Rates have pushed back toward, and in some cases beyond, the levels seen during the COVID-era freight boom. On the surface, that sounds like trucking has simply returned to the good times of 2021 and early 2022. But that misses the most important point: the cost structure of the industry is not what it was then.
It's worth noting that this strength is not evenly distributed. Flatbed and reefer markets have led the recovery and are the primary drivers pushing aggregate rates to these levels. Dry van, while improved, has not fully recaptured COVID-era highs. Carriers in those segments should calibrate expectations accordingly.
The Cost Base Is Not What It Was
Since the COVID-era peak, nearly every major trucking expense has increased. Insurance, maintenance, equipment payments, driver-related costs, and other non-fuel operating expenses are all materially higher. Many major cost categories are up 15% to 30% compared with the pandemic period. Insurance costs are up around 18%. Maintenance is up about 20%. Truck payments are up 23%. Across the full operating model, non-fuel cost per mile has risen roughly 21%, from about $0.68 per mile during the COVID era to about $0.82 per mile today.
It's worth being honest about what's inside that 21%. Part of it is straightforward cost inflation. But part of it is the freight recession itself. When trucks ran fewer miles through the downturn, the same fixed costs got spread across fewer miles, which pushes cost per mile up even when the underlying bills hold steady. Two forces, pointing the same direction. The driver feels both.
That means a rate that looked highly profitable during the COVID freight boom does not produce the same result today.
Take Fuel Out of the Equation
The cleanest way to compare the two periods is to remove fuel from the equation. Because of geopolitics, wars, and the like, fuel prices can swing dramatically from month to month and distort the headline rate environment. By excluding fuel, we get a more apples-to-apples comparison of what carriers are actually earning against their underlying cost base.
During the COVID-era peak, spot rates hit roughly $3.15 per mile. After neutralizing fuel, that translated to about $2.81 per mile.
That $2.81 is the number that matters for comparison, but only once you adjust it for today's costs. Non-fuel cost per mile has risen about 21% since then. To produce the same profit per mile carriers earned at the COVID peak, after covering that higher cost base, the fuel-neutralized rate needs to reach roughly $2.95 today. That is the cost-adjusted bar, the number that tells you whether profitability has actually recovered, not just whether the headline rate looks bigger.
Current spot rates have reached approximately $3.65 per mile. After neutralizing fuel, that translates to about $3.05 per mile.
So for the first time since the COVID boom, the fuel-neutralized rate has crossed the cost-adjusted threshold. $3.05 against a $2.95 bar. That is real, and it's worth acknowledging after three years of grinding. But notice how narrow it is. Gross rates blew well past their COVID highs, yet on a cost-adjusted basis the market has cleared the line by only about 3.4%. The victory is real, but it's a turning point, not a return to the boom.
What This Means for You
The benefit will vary based on equipment type, region, lane mix, debt structure, and operational discipline. Carriers with newer equipment, lower insurance costs, stronger customer relationships, and better network balance have felt the upside first. Those carrying large equipment payments, high repair costs, or poor lane density may still feel pressure even as rates rise. A market that has cleared the bar by 3% on average leaves plenty of operators still sitting below it.
For carriers, the current market creates an opportunity to rebuild balance sheets and bank accounts after a long freight recession. The carriers that survived the downturn now have a chance to restore margins, pay down debt, invest in equipment, and regain pricing power. But discipline still matters. A rising rate environment can disappear quickly if carriers over-expand, chase poor freight, or ignore costs. With the cushion this thin, that discipline is the difference between clearing the bar and slipping back under it.
For owner-operators considering whether now is the time to move to their own authority, the current rate environment may feel like the green light they've been waiting for, but history suggests real caution. These upswings tend to be shorter than they feel in the moment. The decision to go independent carries long-term fixed costs and operational complexity that don't disappear when the market softens. Make that call based on a sound long-term business plan, not the current headline rates. Running an updated profit plan with your ATBS Business Consultant is the best way to make a good, rational, long-term decision.
For shippers, the message is equally clear. The low-rate environment is over. Capacity has left the market, operating costs are structurally higher, and carriers are no longer in a position to absorb cost increases without passing them through. Shippers that wait too long to adjust their procurement strategies may find themselves exposed to tighter capacity, higher spot rates, and weaker service reliability.
Know Your Numbers
The trucking market has changed. Rates are not rising because of a short-term seasonal spike or fuel volatility. They are rising against a backdrop of reduced capacity and a structurally higher cost base. And while the headline numbers have passed COVID-era highs, the math underneath shows a market that has only just clawed real profitability back to even.
The data is clear. We are in the upcycle. But the years of depressed margins, and the overextension that came with them, are exactly why the conversations on the ground still sound cynical. That mindset is understandable. A 3% cushion is not a reason to abandon it, it's a reason to keep it.
Through the downturn, ATBS focused on getting back to the basics: know your numbers, and make decisions based on those numbers instead of the emotion of the moment. A rising market is the best possible time to put that discipline back into practice.
Later this summer, we'll release our mid-year IC Benchmarking report, a state-of-the-industry look at how these improved rates are actually changing owner-operator and fleet performance. For fleets that get pulled into the whirlwind of their own results, it shows how you stack up against peer fleets and gives you real data to adapt your business, not just a read on your own four walls.
For our owner-operator clients, now is the time to take stock of what worked over the last few years and what didn't, and let ATBS help you turn those lessons into a business plan built for today's market. What matters isn't what happened in the past. It's how you use what you learned to meet the market where it is now.
That's the work we're built for: setting fleets up to grow, and putting owner-operators in the best position to reach their business and financial goals.